Research Note #1: Civic Attitudes by Demographic Group
Secondary analysis of LAPOP AmericasBarometer Haiti data (2021 and 2023) · Published July 3, 2026
Our research question: how does sentiment on civic topics vary across demographic groups? Before collecting any new data, we analyzed the best data that already exists: the LAPOP AmericasBarometer survey (Vanderbilt University) — a nationally representative sample. We used the 2023 data (1,611 respondents) and the 2021 data (3,088 respondents), with LAPOP's sample weights, bootstrap confidence intervals, and a Holm correction for multiple tests. Our results reproduce LAPOP's officially published figures — confirming our method is correct.
The National Picture (2023)
The data's message is clear: Haitians have not abandoned democracy as an idea — they have lost confidence in how it is practiced. And despite the entire crisis, only 11% say change is impossible. The appetite for democracy is there; it is confidence in the machinery that is missing.
Confirmed Finding: Insecurity Is Concentrated in the Metro Area
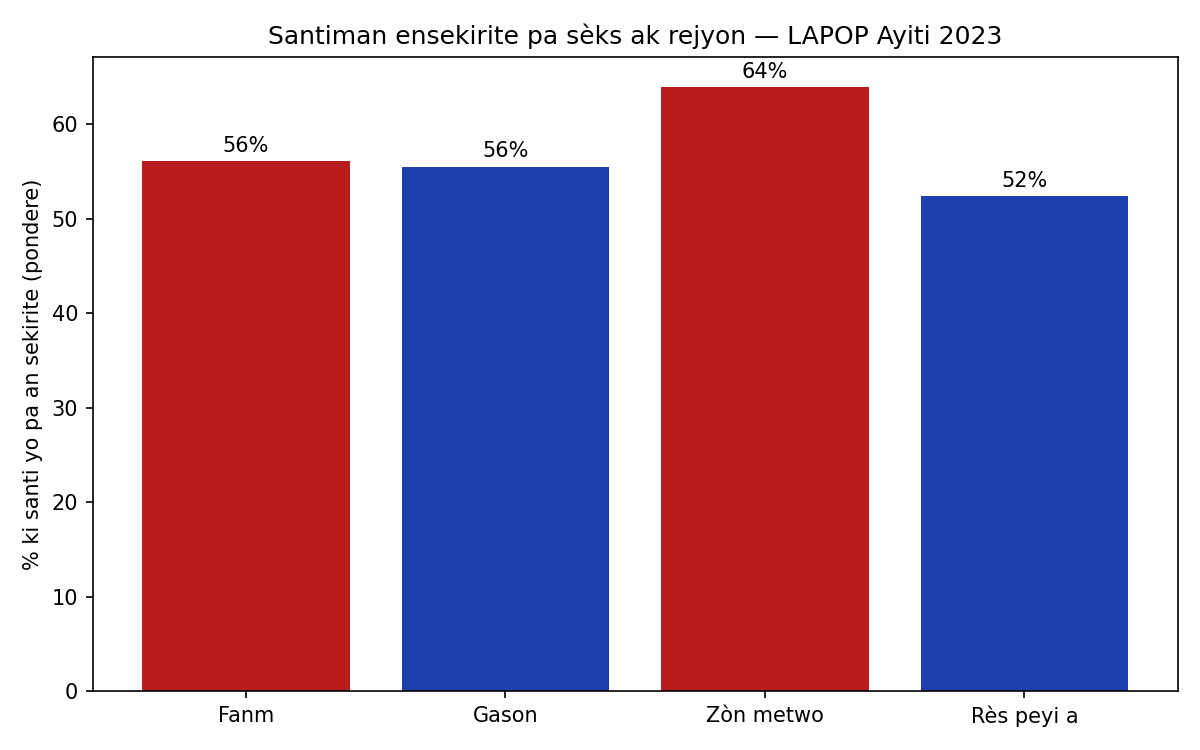
Of the five hypotheses we specified in advance, one was confirmed after statistical correction: residents of the Port-au-Prince metropolitan area feel unsafe about 11.5 percentage points more than the rest of the country (p=.03). They also perceive more corruption (64% vs 47%). Insecurity sentiment is not uniformly national — it is concentrated where the gangs are.
The Surprise: Youth Trust Elections — But Are Less Sure They Will Vote
A gap between trust and participation
In the 2023 data, youth aged 18-29 trust elections more (29.6%) than people 30-44 (20.7%) and 45+ (21.5%). Yet these same youth are less likely to say they would vote for a candidate (35.8% vs ~43% for both older groups). For young Haitians — who have never had the chance to vote in a national election — the problem appears to be not distrust, but missing habit and connection.
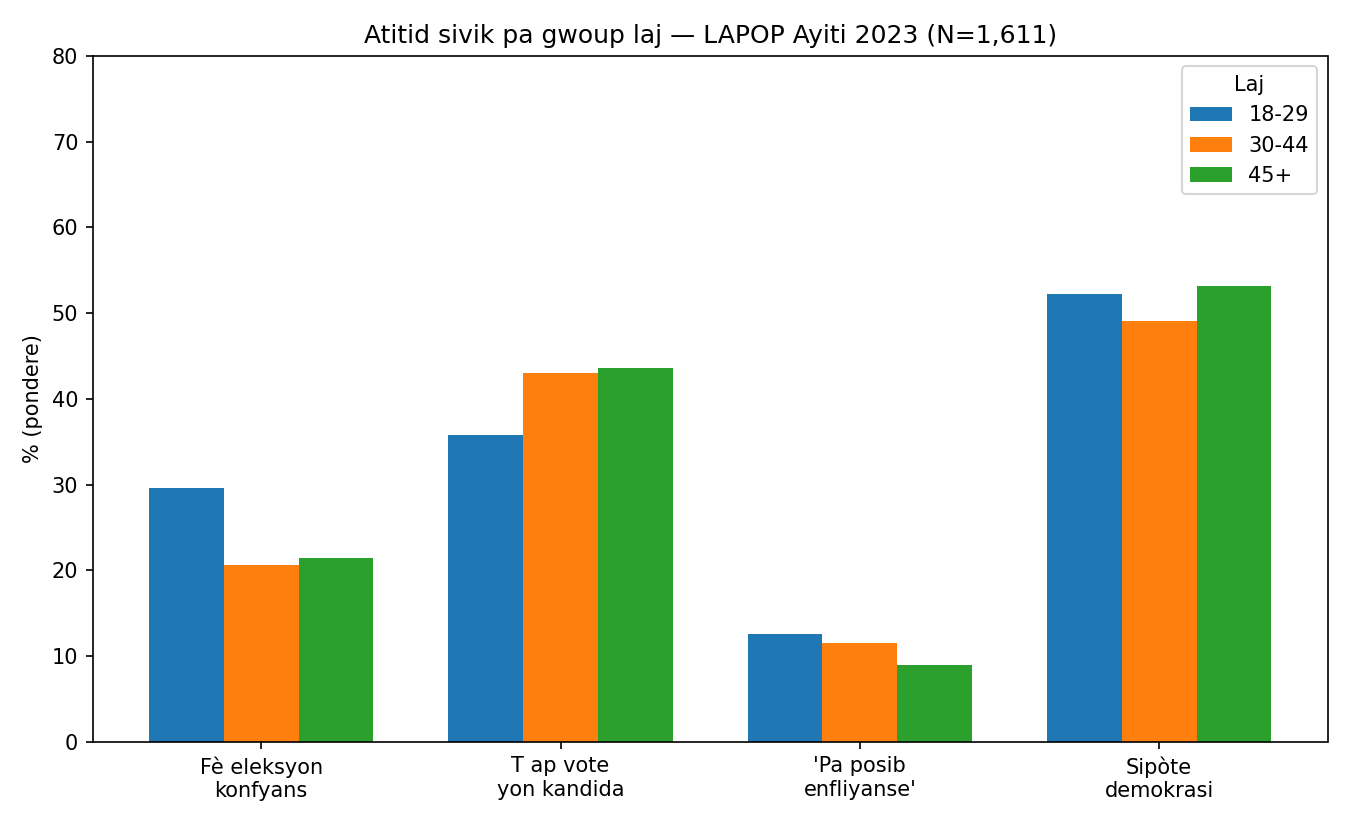
Scientific caution: this pattern did not appear in 2021 — that year, it was youth who trusted elections less (23.5% vs 30% for 30-44). So this shift happened between 2021 and 2023, and it could reflect statistical noise or a real generational change. We treat it as a hypothesis to confirm — not a final conclusion — and we are formally registering it as the primary hypothesis of our next study.
UPDATE (July 3, 2026, following Note #2): When we analyzed the full 2006-2023 series (8 waves), the 2023 youth trust advantage turned out to be the largest gap in the entire series — in five of seven waves, youth trusted elections LESS. This strengthens our caution: the trust advantage may be an anomaly. The youth participation deficit, however, is a trend confirmed across multiple waves (+2.5 in 2014, −5.3 in 2016-17, −7.5 in 2023). See Research Note #2 for the full historical context.
Trends 2021 → 2023
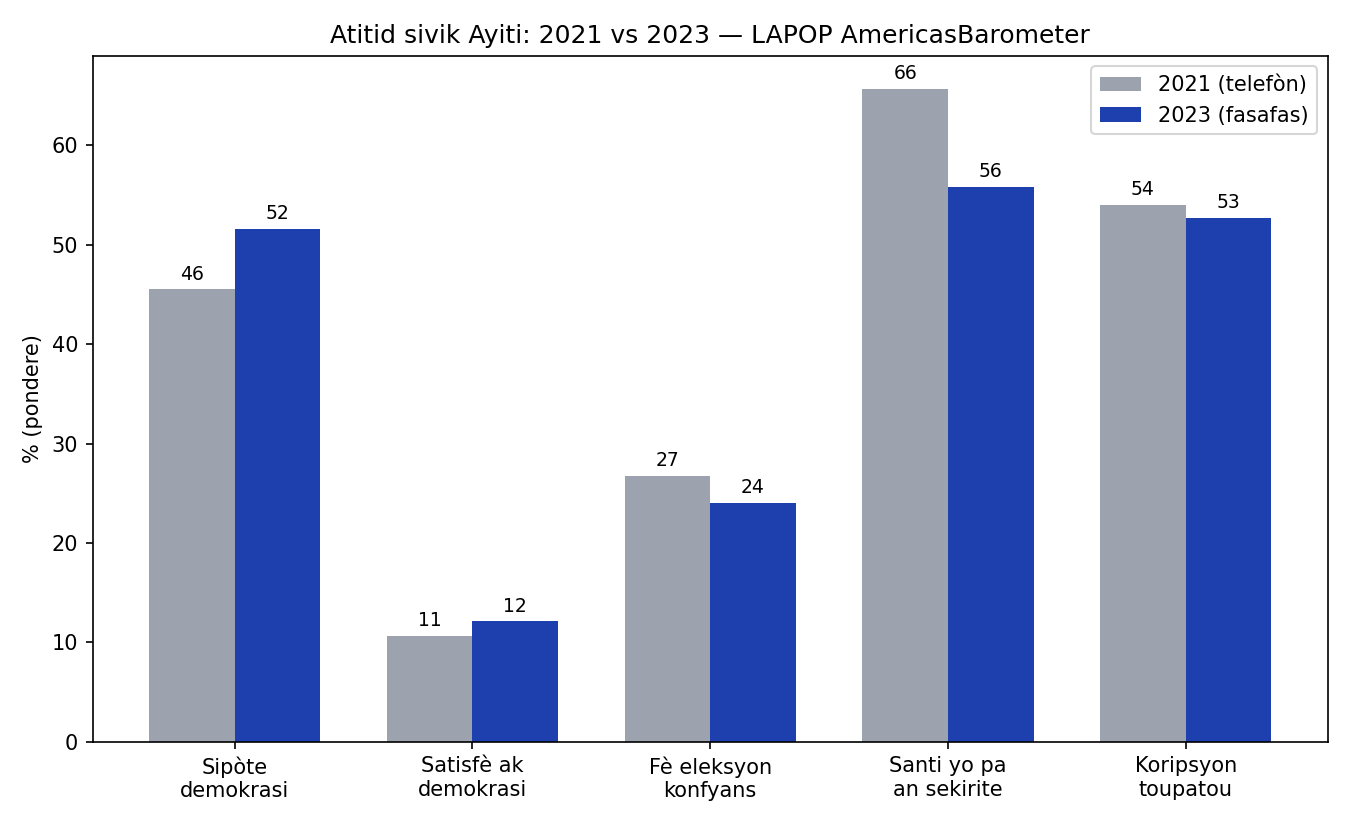
Support for democracy rose from 45.5% to 51.5% (a statistically significant increase, p=.008) — during one of the worst periods in the country's modern history. Trust in elections stayed stable (27% → 24%). One result looks strange: the share saying they feel unsafe fell (66% → 56%) — but we do not believe this means safety improved.
Important limitation: the 2021 survey was conducted by telephone (COVID period, before the president's assassination), while the 2023 survey was face-to-face — and face-to-face fieldwork cannot enter the most dangerous areas. So the drop in insecurity sentiment may reflect WHO could be surveyed, rather than a real improvement. We say this plainly because honest research requires showing our data's weaknesses as clearly as its strengths.
Other Results
- No difference between women and men in feeling unsafe (0.6 points, not significant) — insecurity is universal.
- Education level does not predict political interest (2.8 points, not significant).
- Households with relatives abroad are not more electorally enthusiastic (not significant); but remittance-receiving households show a positive signal (+7.5 points, exploratory).
- Only 10.7% trust the Prime Minister; 52.7% say corruption is widespread among politicians.
Methods and Transparency
Data: LAPOP AmericasBarometer Haiti 2023 (N=1,611, face-to-face) and 2021 (N=3,088, telephone), with official sample weights. Some questions were asked of only half the sample (n≈570-780). All estimates are weighted; confidence intervals use a stratified bootstrap (1,000 replications); we specified 5 hypotheses in advance and corrected for multiple testing with the Holm method. We cannot republish LAPOP's raw data (license terms), but all our aggregate results and methods are described here, and our analysis code is available on request: research@ayitisitwayen.org.